Advertise where your audience actually lives
Many event organisers choose advertising locations by gut feeling. With the postcode map in Ovatic, you know exactly where your ticket buyers live — and direct your budget accordingly.
Many theatres and event organisers choose their advertising locations by gut feeling. “That street is always busy”, or “we always put our posters up in the city centre.” But what if you knew exactly where your ticket buyers live — down to neighbourhood level — and could direct your budget there? With Ovatic, you can.
From gut feeling to postcode map
Triangular advertising boards, flyer drops, social media ads in a specific neighbourhood: these are all forms of local marketing. Used wisely, they can make a real difference. But “local” is of course a broad concept. The city centre is not the same as the neighbourhood where three-quarters of your audience actually lives.
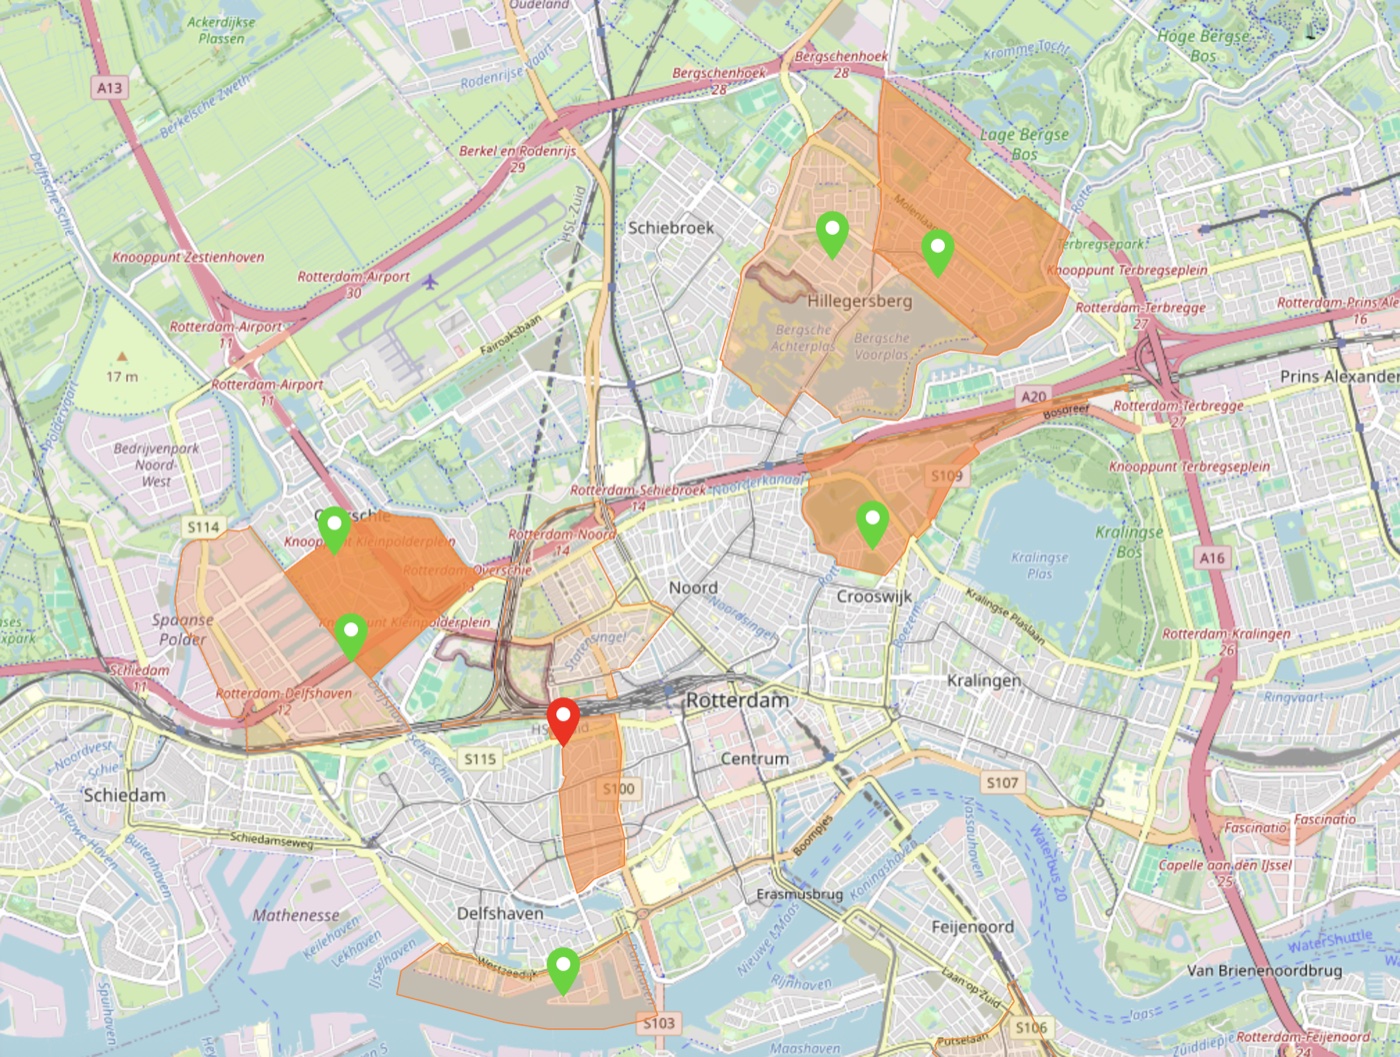
In Ovatic you will find an interactive map that makes exactly that visible. Per activity, activity group or customer group, you can see at a glance how many tickets have been sold per 4-digit postcode area or at cadastral neighbourhood level. The neighbourhood boundaries and postcode areas are based on data from Statistics Netherlands (CBS) and the Land Registry (Kadaster), so you always work with official geographic divisions.
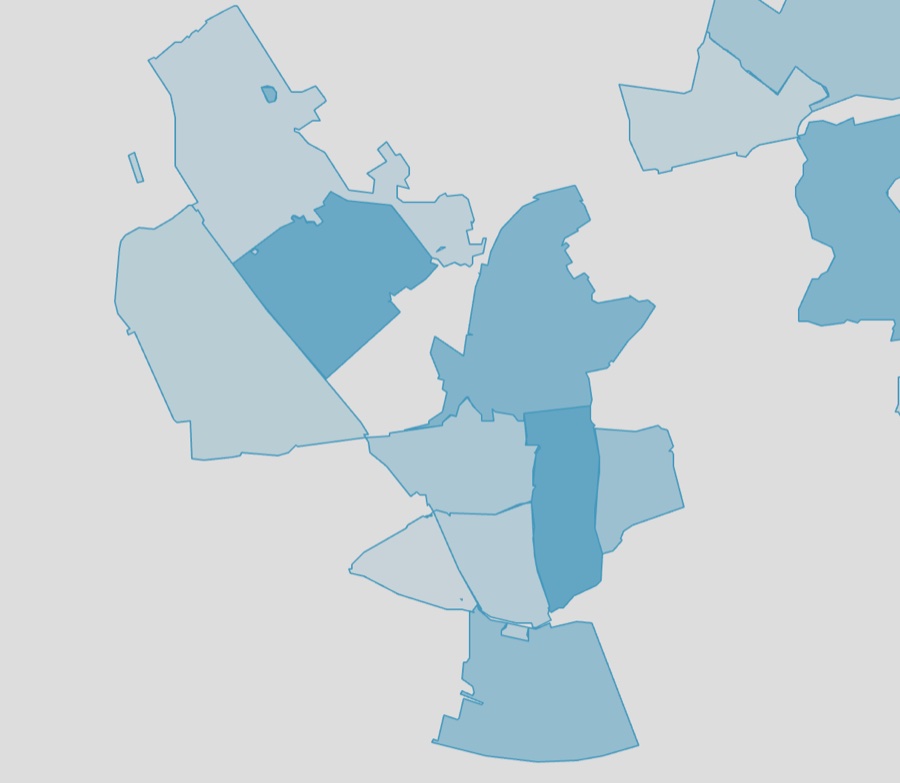
Postcode areas — broader geographic zones per 4-digit postcode
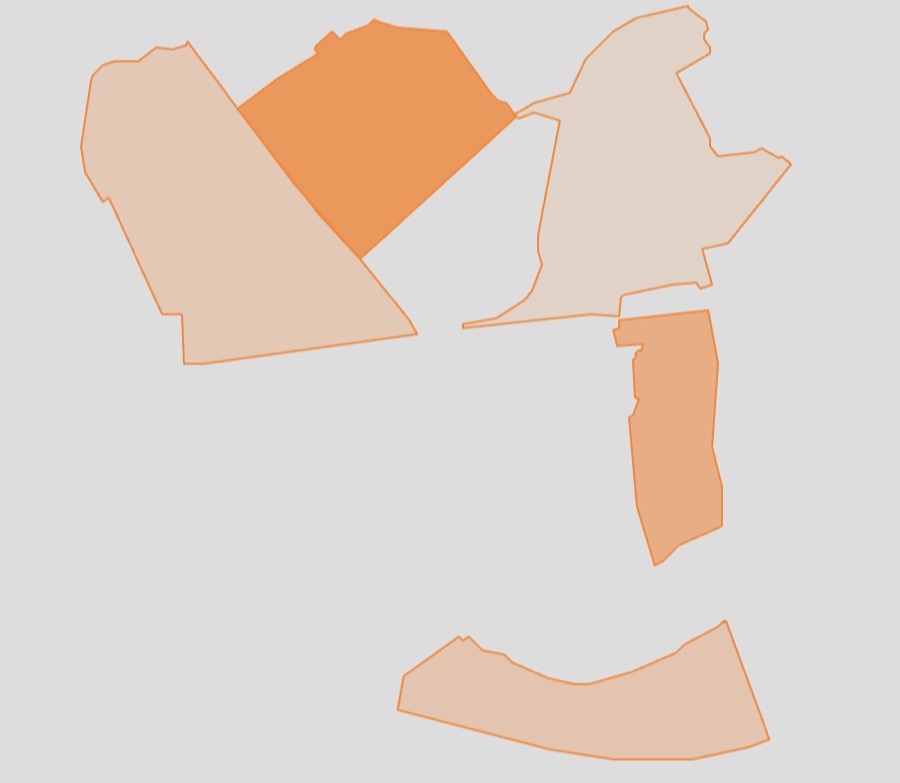
Neighbourhoods — more detailed insight at district level
The map responds to your data: darker means more buyers from that area, lighter means barely any reach.
That map is not decoration. It is the foundation of a sharp advertising strategy.
Triangular boards: old medium, new precision
The triangular advertising board — the rotating display pillar you see at busy spots around town — is a proven outdoor advertising format. Visible, physically present, impossible to click away. But its effectiveness stands or falls with the choice of location.
Suppose your postcode map shows that a large share of your audience lives in two specific neighbourhoods. It then makes sense to direct your budget precisely there — at the supermarket in that neighbourhood, at the sports centre, at the roundabout everyone drives through — rather than generically in the city centre.
The Ovatic map helps you in three ways. You see which neighbourhoods are overrepresented in your customer base. You see whether your audience lives in a concentrated or spread-out pattern, which determines whether a few boards in one spot will do the job or whether you need broader coverage. And you discover the blind spots: neighbourhoods close to your venue where barely any tickets are sold, and which therefore hold potential if you make yourself visible there.
Social media by region or neighbourhood
Meta (Facebook and Instagram), TikTok and LinkedIn all offer the ability to target ads at specific geographic areas. You can choose a radius around a point, a city or a province — but also specific postcodes or neighbourhoods. The latter is exactly where the Ovatic map proves its value.
Suppose you organise an annual theatre festival. The sales map shows that a number of postcode areas consistently convert well, while other neighbourhoods at a comparable distance are barely represented. You can then do one of two things: increase your budget in the areas that are already performing well, giving people who are already interested an extra reminder. Or run a separate campaign targeting the underperforming neighbourhoods, with a slightly different message or a lower-barrier element such as an early-bird discount.
That is the difference between a broad campaign that reaches “everyone in the region” and a campaign that truly aligns with the geography of your audience.
Location targeting and geotargeting: what is the difference?
The terms are often used interchangeably, but there is a nuance. Location targeting means directing ads at people who live in or are present in a specific geographic area — a city, region, postcode area or neighbourhood.
Geotargeting goes one step further: you combine the geographic angle with behavioural data or interests. You then target not just people in a postcode area, but people in that postcode area who also have an interest in culture, music or sport — depending on your event.
The map in Ovatic gives you the geographic input. You then combine that with the targeting options of whichever advertising platform you choose. In this way, your own sales data becomes the starting point of your advertising logic.
Segment by activity or customer group
The Ovatic map not only shows you where your ticket buyers live — you can also zoom in on specific groups. Wondering whether the audience for your children’s shows lives in the same neighbourhoods as the audience for your evening programme? With the filter option per activity or activity group, you see that immediately, and quickly discover whether you are reaching the same people or quite different groups.
The same applies to customer groups. Do you have regulars, newcomers or specific membership groups? By filtering, you see how the geographic spread differs per group. Your loyal customers may be concentrated in one neighbourhood — making it smart to anchor your campaign for them locally there with an advertising board or flyer drop, combined with a targeted online campaign.
From map to campaign plan
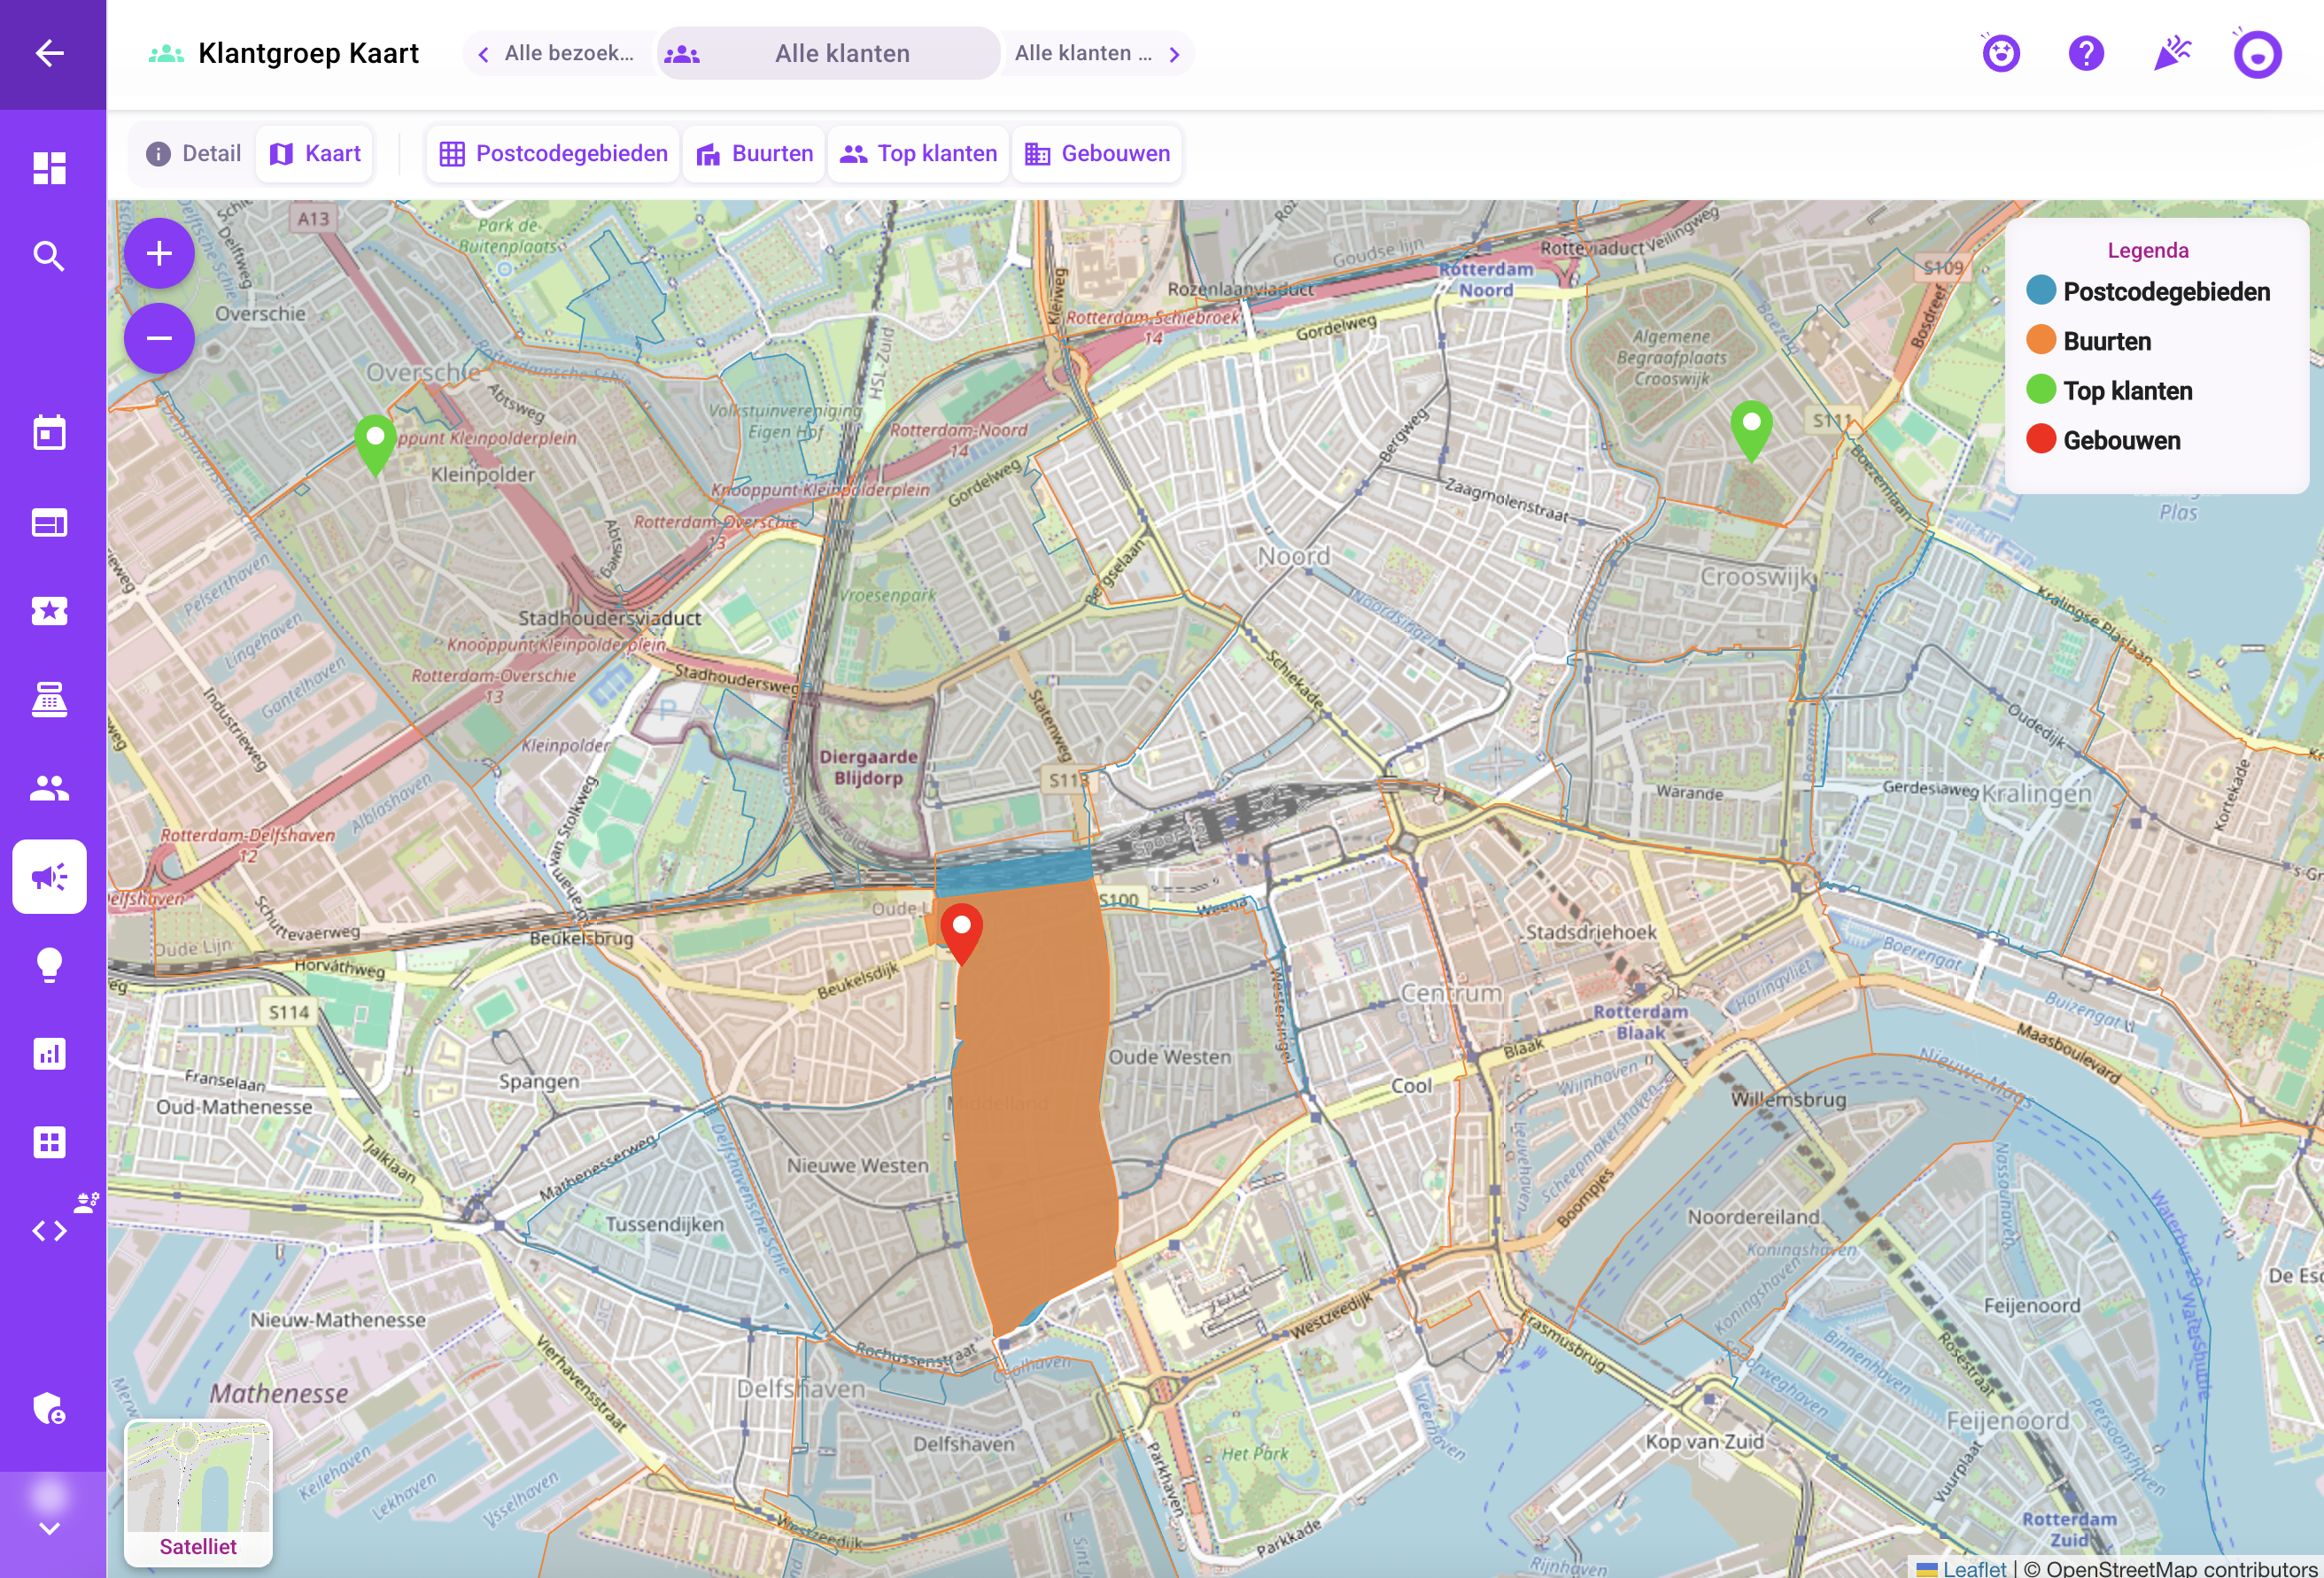
In practice it works like this: open the Ovatic map and select the activity or season you want to analyse. Look at which postcode areas or neighbourhoods have the highest concentration of buyers, and identify the spots where sales are lagging despite the proximity of an audience. Use this to plan your advertising boards along the main routes in those neighbourhoods, and set up your social media campaigns using those postcode areas as the targeting unit. After the event, open the map again and see whether the new areas have started to move.
Your data is your advantage
Instead of advertising on gut feeling, you can advertise based on your own sales history. The map functionality in Ovatic turns your ticket data into a practical instrument: for better-placed advertising boards, sharper social media targeting and a location strategy that is not based on assumptions, but on evidence.
Want to see how the map feature works within Ovatic? Get in touch and we’ll be happy to show you.
Want to see Ovatic in action?
Book a free 30-minute demo tailored to your organisation. No obligations.